| Electronic Supplementary Material accompanying the paper entitled "EGene: a configurable pipeline generation system for automated sequence analysis" by Durham, A.M., Kashiwabara, A.I., Matsunaga, F.T.G., Ahagon, P.H., Rainone, F., Varuzza, L. and Gruber, A. Bioinformatics 21(12): 2812-2813, 2005. |
|
|
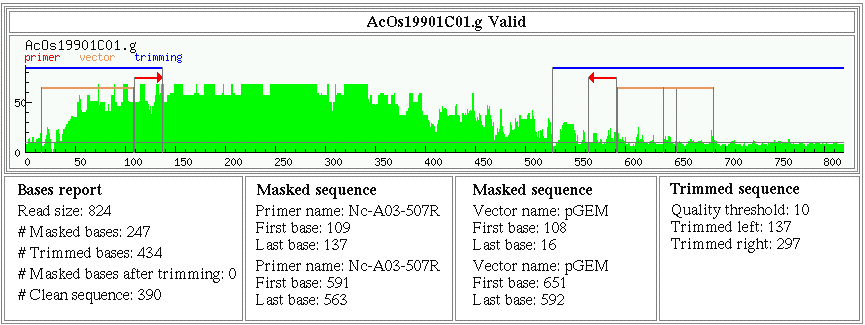
| Fig. 1. EGene complete graphical report of a DNA sequence read taken from the Eimeria ORESTES Project. The read corresponds to a cDNA synthesized by RT-PCR using 18 to 25-mer arbitrary primers under a low stringency. The graph shows the Phred quality (Y-axis ranging from 0 to 90) along the sequence (X-axis), with a continuous horizontal line denoting a threshold Phred quality value of 10. A sequence scale is also indicated. Regions spanning primers (red arrows), masked bases (orange horizontal bars) and trimmed stretches (blue horizontal bars) are indicated on the graph, and the respective descriptions are shown in the boxes at the bottom. This visual representation was inspired by the graphical report described by Paquola et al. (2003). |